GV12/3072
Coursework 3
This is the third
coursework for course GV12/3072 on Image Processing. This coursework is
on edge detection. For a basic pass in the coursework (50%), you need
to do the core section. To get full marks (100%) you must succeed in
completing two of the
additional sections.
I recommend that you use matlab.
Hand in a short report on your work, which should be two written sides
of A4 at most, plus any pictures and plots showing your results and a
print out of your code. The short report should start with a brief list
of what you have attempted and to what extent you have acheived each
item. Next, write a short description of the methods you used for each
part together with any conclusions you have drawn from your
experiments. Make sure it is clear what commands you used to generate
each of the pictures you include. Indicate the kernel values and any
other parameters used for each figure.
The definitive hand-in deadline for this coursework is 12:00 (noon) on
1st December. Hand in your
report to
JJ or Tricia in the CS departmental office. Make sure you attach a
completed coursework
cover sheet to your work.
Core section
Here is the test
image:
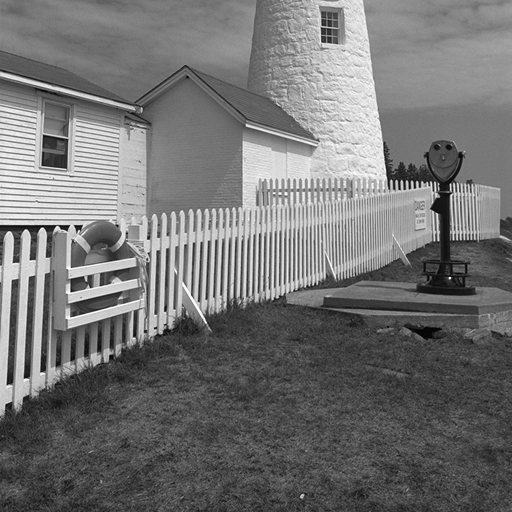
We would like to locate the edges in the image as consistently and
accurately as possible. The core part is:
- Compute edge
maps (ie follow the "Simple edge-detector" procedure from the lecture
notes) for the image using YOUR OWN
(a) Sobel edge detector (Sobel filters and thresholding), (b) Prewitt
edge detector (Prewitt filters and thresholding), (c) an edge detector
using derivative of Gaussian filtering in place of the Sobel/Prewitt
kernels and (d) the built-in Canny edge detector implemented in matlab.
Compare the output visually and comment on which you think is best and
why.
List the tunable parameters in each edge detector and explain how you
chose settings for each. Note: the default parameter settings are not
necessarily the best, and your results may differ from the built-in
Canny function.
- Implement a non-maximal suppression algorithm and use it on the
responses of the filters you used in (c) above.
- Implement hysteresis thresholding and generate binary edge maps
from the non-maximal suppression results obtained above. One possibility is to
use bwselect(). Here, you can ignore orientation.
Describe how you choose settings for the thresholds in your algorithm.
Comment on how the results compare with matlab's Canny edge detector.
Additional section
You do not need to do
all of these, but must correctly complete two of them to reach full
credit.
- Implement an alternative hysteresis algorithm that uses the edge
orientation in each pixel in the test to determine whether it has a
neighbour already in the edge map. Does the adaptation improve results?
- The use of a scale space pyramid can improve on standard
hysteresis. Rather than starting with edge maps from high and low
thresholds, start with edge maps from high and low standard deviation
in your Gaussian kernels. What differences do you observe? Extend your
hysteresis to use the whole series of edge maps from increasing
standard deviations in the Gaussian kernels.
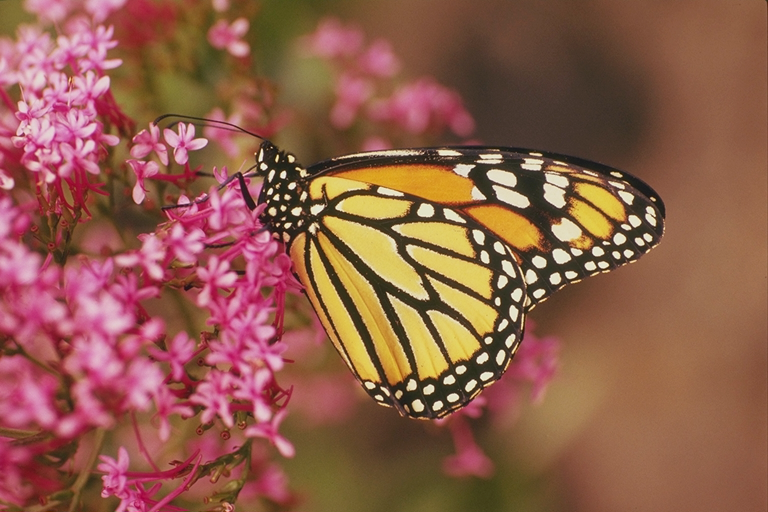
- Construct a ground
truth edge map by labelling just the main edges of the
butterfly's wings (or more detail, if you feel like it) in the
following image by hand. Construct ROC curves for your version of the
Canny edge
detector and compare its performance to the built-in Canny. Explain how
you classify
pixels in your edge maps as true/false positives/negatives.
- The alternative to the
ROC that may be more suitable for evaluating
edge detectors is the precision-recall (PR) curve. Precision (vertical
axis) is the fraction of detected edges that have a matching edge in
the ground truth. Recall (horizontal axis) is the fraction of
ground-truth edges that are detected. Plot the PR curve using a simple
matching procedure that simply marks edge pixels in one map as matched
if there is an edge pixel within distance D in the other image; varying
D produces the PR curve. Hint: use the distance
transform.