


Next: About this document
Slide presentation for Genetic Programming 1997 Conference 
W. B. Langdon
School of Computer Science,
University of Birmingham, UK
Evolutionary and Emergent Behaviour
Intelligence and Computation (EEBIC)


Analysis of the MAX Problem
(pages 222--230)
W. B. Langdon and R. Poli
- What is the MAX Problem
- Confirm Gathercole, GP-96, but
- GP solution mechanism modelled
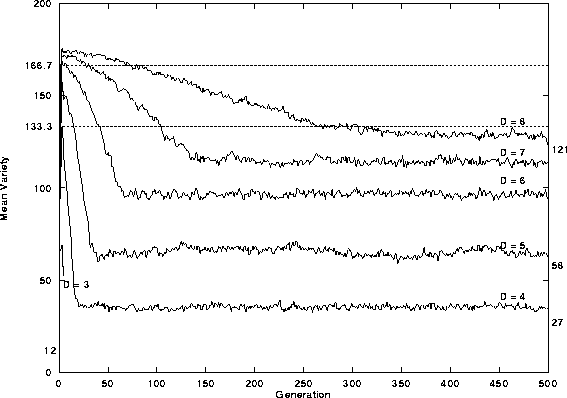
- Initial and Evolution of Variety
- Tournament Size
- Impact of depth limit on Price
- GP as hill climber
- Conclusions
Why MAX Problem
- Little GP theory
- Analyse benchmark problem
- Later stages of MAX not deceptive, why difficult?
- Strong scalar fitness
 breeding pop = one solution
- Pop stuck near root
- Generally true GP?
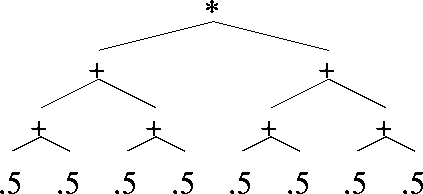
MAX Problem
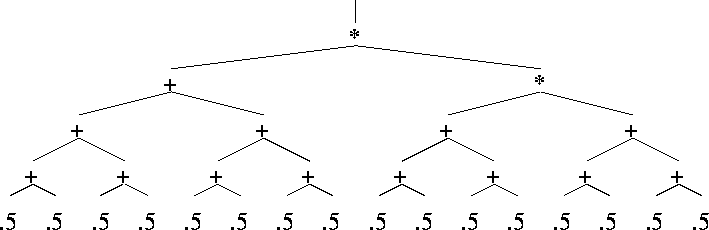
One of the four solutions to
MAX-depth-4-{*,+}-{0.5} = 16
- Find tree with max value within limited size
- Function set {*,+}, terminal set {0.5}
- Depth limit D
- Max value
 ,
,  optimal trees
Why MAX is hard for GP
- No negatives
 + always increases fitness
- * arguments
 for good as +
- Initially growth of +
- GP converges towards + near root
- later need * near root
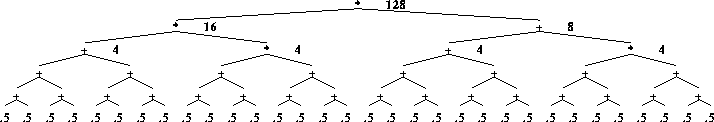
Near solution to
MAX-depth-5-{*,+}-{0.5} = 128 (optimal 256)
+ Difficult to Replace
- low crossover activity near root
- depth limit + full tree
 xo can't move big to small
-
 small
small  low fitness
  RIP
RIP
-
 hard near root
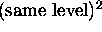
- iff * in same level
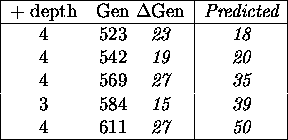
How long to Replace +
- Special case 1 + node at level d
-
 crossover point
pairs
crossover point
pairs
-
 crossover points
-
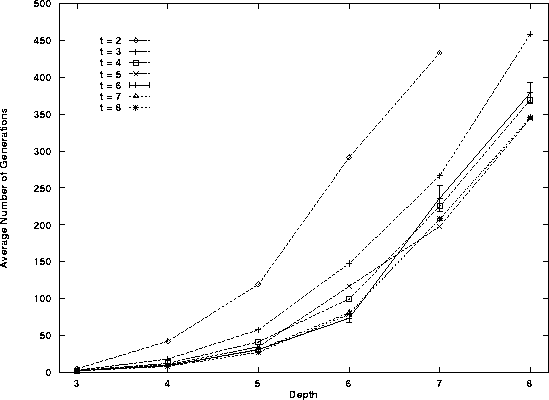
The expected gens to improvement

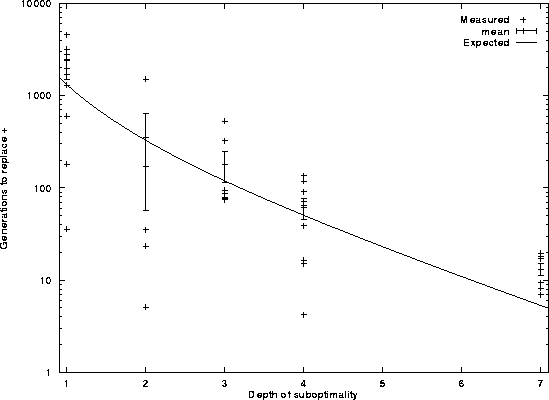
Number of generations to displace
last misplaced + (D = 8)
Error bars indicate standard error
How long to Replace +
- When multiple + gets messy
- Lower bound xo at same level + nodes

- Detailed counting end of one run
How long to Solution
- Long periods with no improvement
- Whole pop accepts next improvement
- Ie GP hill climbs.
- Time for each step O(
 )
)
- For large D, runtime is dominated by time to replace + near root
- Total time also O(
 ).
).
- Search space O

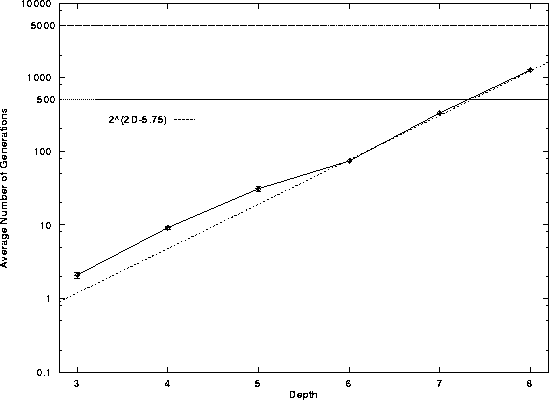
Mean number of generations
(successful runs)
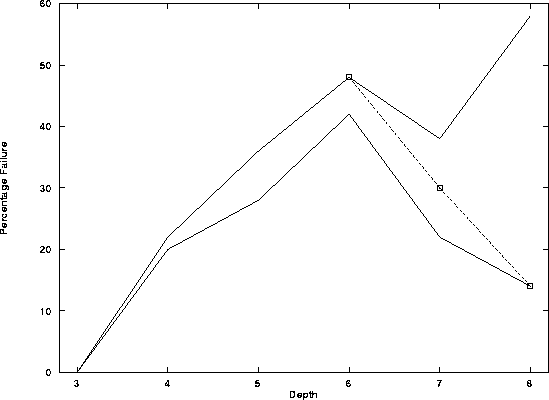
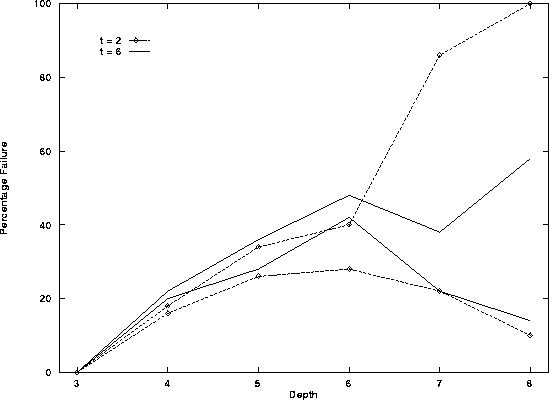
Percentage of runs ending in failure, 500, 5000 gens
Lower curves shows percentage of failed runs with no
 in a higher level.
How Many Steps to Solution
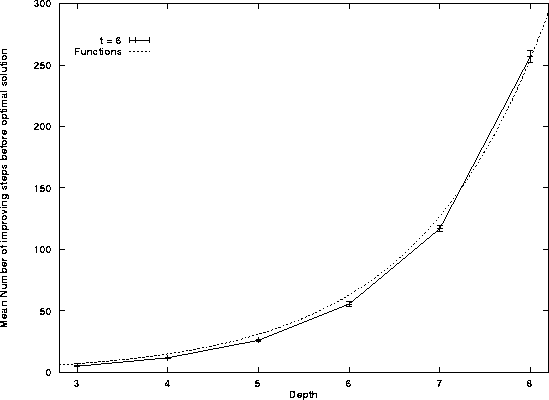
Improved solutions found before optimal solution in
successful runs.
- Number of steps
 functions in tree
Conclusions
- lack of GP theory, analysed published example
- Pop sticks at root
- No introns/side effects to work around blocked root
- Role for analysis
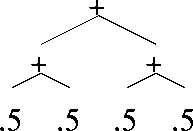
Variety in initial populations
Predicted v. Mean of 50 runs
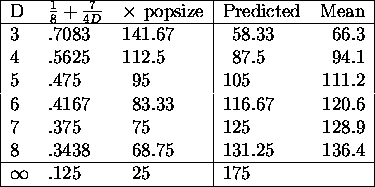
Number of different trees
Trees from xo full trees one function per level
Mean number of gens, successful runs
Percentage of runs ending in failure
Lower curves no  in a higher level
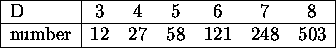
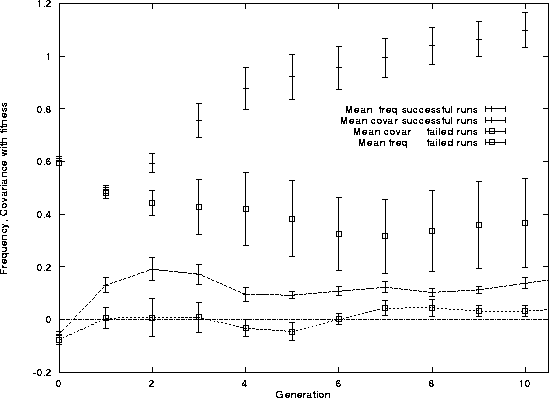
Cov and freq *
(d = 1, D = 5)
Next: About this document
William B Langdon
Thu Jul 24 17:45:21 BST 1997
 &
& poor
poor