Tutorial: Data synthesis
Synthetic data is useful when a ground-truth is required. For example, when testing a new technique for reconstructing fibre directions, or for optimising scan parameters to maximise directional accuracy. Camino is capable of synthesising test data in several different ways including single or mixed tensors, with noise added at a given SNR. Camino also provides a more sophisticated method of generating test data which uses Monte-Carlo simulation of spins in an environment that restricts their motion. This case study illustrates how to synthesise data both from test functions and simulation and how to extract directional statistics from the synthetic data.
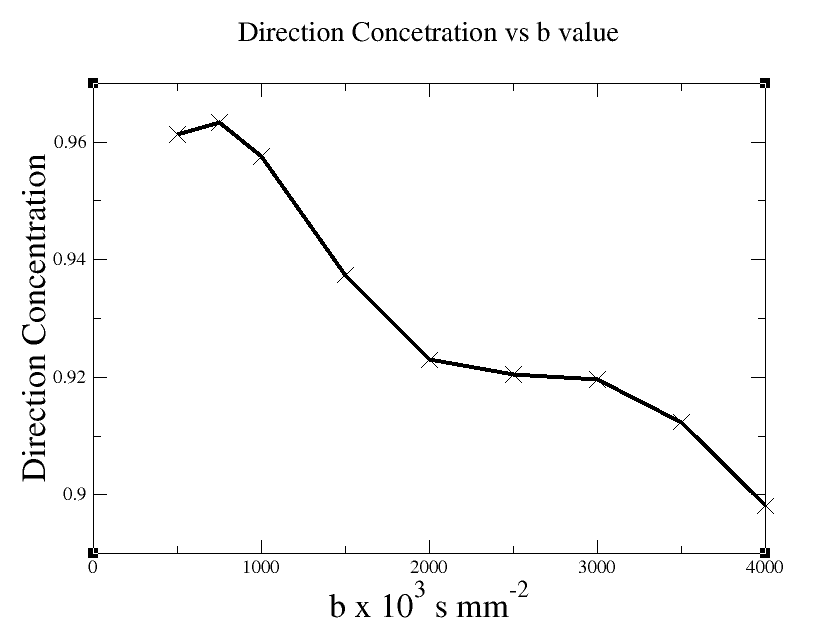
This case study describes how to generate data for a plot of the dependence of direction concentration of principle diffusivity as a function of b-value of scan. We describe how to generate synthetic data from test functions and also using data derived from Monte-Carlo simulation
Synthesising tensor data using test functions
We can synthesise data assuming the single tensor model using the following command:
datasynth -testfunc 1 -snr 16 -schemefile test/bmx7.scheme -voxels 25 > tensorVoxels.Bfloat
We have specified:
-testfunc 1indicating a single gaussian test function with diagonal (17,2,2) x 10-10m2s-1.(seedatasynth(1))-snr 16specifies a signal to noise ratio of 16.-schemefile tensorScheme.schemespecifies the schemefile, which gives diffusion time, wavenumber q and gradient acquisition directions for the synthetic zero vectors for unweighted images should always be listed before non-zero graddient directions in a schemefile.(seecamino(1))-voxels 25specifies that 25 voxels of data are to be synthesised.tensorVoxels.Bfloat
Inversion statistics
Beyond just synthesising results via some appropriate methods, we are also interested in the directional statistics of diffusion tensors fitted to the data in order to make an application of the simulation to scan parameter optimisation. invstats is a camino module that calculates several different statistics from a sequence of voxels containing fitted tensors. By simulating several voxels, fitting tensors and piping the results to invstats we can obtain several directional statistics; the output of invstats (in order) is
- The number of trials over which data is computed. This should be the same as the number of voxels.
- The fraction of trials that were successful
- The mean principle direction (x,y,z)
- The eigenvalues of the mean dyadic (l1,l2,l3)
- The mean trace of the diffusion tensors
- The standard deviation of the trace
- The mean Fractional Anisotropy (FA)
- The standard deviation of the FA
Here we are interested in the largest eigenvalue of the mean dyadic. The mean dyadic is a tensor-valued statistic object that may be used to derive information from directional data. It is constructed in the form of a matrix Y with elements

where ei(k) is the ith element of the kth direction (here the principle eigenvector of the diffusion tensor fitted to the kth voxel). See [1] for more details. The largest eigenvalue of the mean dyadic is a measure of the direction concentration. If all directions in the sample are equal, the direction concentration is 1, is they are uniformly distributed it is 0
The analysis pipeline
Putting all of this together, a pipeline for data synthesis from functions and analysis of results is:
datasynth -testfunc 1 -snr 16.0 -schemefile test/bmx7.scheme -voxels 1000 | dtfit - test/bmx7.scheme | invstats -inversion 1 -voxels 1000 > inversionStats.Bdouble
which will synthesise 1000 voxels from test function 1 and pipe the results to dtfit, which fits diffusion tensors to the synthesised data, and then on to invstats to obtain directional statistics.
Generating results
To examine the dependence of direction concentration on b-value, we need to generate synthetic data to be piped to invstats for each b-value of interest. Scan parameters for various b-values are generated using the proceedure outlined in [1], which optimises SNR for combinations of scan. Scan and data parameters and SNRs for each b-value are shown below:
Table 1: Parameters used in synthesising data
| b | delta | DELTA | SNR |
|---|---|---|---|
| 500 | 0.0231 | 0.0271 | 18.7451 |
| 750 | 0.0266 | 0.0306 | 17.1569 |
| 1000 | 0.0294 | 0.0334 | 16 |
| 1500 | 0.0338 | 0.0378 | 14.3333 |
| 2000 | 0.0374 | 0.0414 | 13.1176 |
| 2500 | 0.0403 | 0.0443 | 12.1765 |
| 3000 | 0.0429 | 0.047 | 11.4118 |
| 3500 | 0.0453 | 0.0493 | 10.7647 |
| 4000 | 0.0474 | 0.0514 | 10.1961 |
| 4500 | 0.0512 | 0.0552 | 9.29412 |
| 5000 | 0.0544 | 0.0584 | 8.54902 |
The SNR column shows the SNR with b=0. The procedure in [1] tyakes into account increases in TE required for higher b, which decreases because of T2 effects and causes SNR to decrease with increasing b. Matlab code to generate these values is available on request.
A schemefile for each set of parameters was generated and data synthesised from each parameter set using commands like the following (for b=1000 s mm-2):
datasynth -testfunc 1 -snr 16.0 -schemefile tensor_b=1000.scheme -voxels 1000 | dtfit - test/bmx7.scheme | invstats -inversion 1 -voxels 1000 > inversionStats_b=1000.Bdoubleecho 1000 `cat inversionStats_b=1000.Bdouble | shredder 40 8 96 | double2txt` >> dirnConcs.dat
We have piped the synthetic data into dtfit and then on to invstats and into a file containing all the quantities output by invstats. We then construct a data file of just the direction concentrations by using shredder to pick out the 6th double (8 byte) value from the list of 12 and piping the value into double2txt which converts the byte-stream into a human readable form. This command is run during an echo command that constructs a line of text, which is then appended to the end of a datafile that is used for visualisation using the ">>" operator, which appends to the end of a file.
This part of the script is not strictly necessary, but greatly eases the creation of results from several batches of synthetic data by automating the picking out of items from the output of datasynth. A bash script that synthesises data and constructs the plot of direction concentration vs b value can be downloaded here. The resulting datafile is here. This is plotted below using xmgrace, a 2D data plotter, using the following command
xmgrace -nxy dirnCons.dat
The xmgrace file is here and the plot is shown below
Synthesising data from a simulation
In some circumstances it is desirable to use a more sophisticated method of creating test data. For instance, a study interested in investigating what sort of measurement might be derived from a particular kind of fibre geometry would certainly benefit from a simulation-based approach as it does not impose any strong assumptions on the functional form of the diffusion propagator
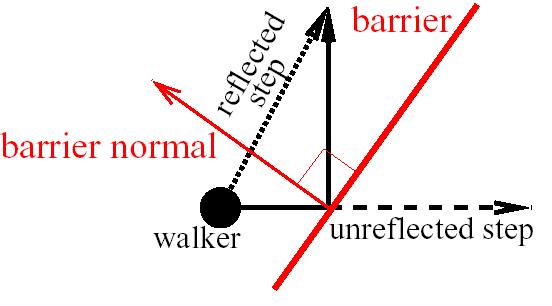
Data is synthesised by simulating data aquisition via a pulsed-gradient spin-echo (PGSE) sequence over a population of "spins" executing brownian motion on a substrate containing barriers which restrict their motion. Spins are initialised on the substrate and their positions updated by generating randomly oriented steps of finite length which is used to increment the spin's position in space. If a particular step would take a walker across a barrier, the walker is allowed to cross the barrier with a fixed probability p or is otherwise elastically reflected.
It is important to stress that the value of p has an extremely important effect on the motion of spins in a simulation. Frequently these effects are counter-intuitive and in order to ensure that simulations produce data that accurately reflects spins diffusing in the brain p should be set to values either very close to (10-5, say) or equal to zero. In this case study we use p=0 throughout.
By chosing a configuration of barriers to reflect a desired situation, the simulation can be used to generate, for example, diffusion with one or more principal directions and to study how scan parameters may be optimised to maximally resolve these directions in the presence of noise.
Simulation parameters
The diffusion simulation is also accessed via the datasynth. In addition to this, several additional parameters need to be specified. Specifying any monte-carlo simulation specific parameters will cause datasynth to use a Monte-Carlo simulation instead of a test function. This section describes the parameters used to define the motion of spins and the synthetic PGSE sequence. Parameters that describe the geometry of the substrate are discussed in the next section, further details are available in the datasynth man page.
A basic command used to generate simulation data is
datasynth -schemefile version1.scheme -voxels 1 -walkers 100000 -tmax 1000 -p 0.0 -initial uniform -substrate cylinder -packing HEX -cylinderrad 1E-6 -cylindersep 2.1E-6
The first two options tell the data synthesiser to start a simulation using the given schemefile and to generate data for one voxel. The scheme file specifies the scan parameters for the synthetic scan the simulation uses to generate data. Simulations can use various different types of scheme file, but a VERSION 1 scheme is the basic type. This specifies PGSE pulse sequences by gradient orientations, duration and pulse separation. The remaining options specify the details of the simulation and scan sequence and work as follows.
-walkersspecifies the number of spins on the substrate. The higher the number the better the statistics will be, but the longer the simulation will take to run.-tmaxspecifies the number of updates in the model. The total time for the PGSE sequence is segmented into this many time increments.-pspecifies the probability that spins are able to step through barriers.-initialspecifies the initial distribution of spins in the simulation environment. Theuniformoption indicates that spins are uniform-randomly distributed across the environment. Thedeltaflag causes all spins to be initialised at the same location in the centre of the diffusion environment.-substrate(or-geometry) specify what the diffusion environment looks like. Here we've specifiedcylinderwhich defines regular packed cylinders parallel to the z-axis.-packingSpecifies either SQUARE or HEX for the regular packing for cylinders.-cylinderradThe radius of cylinders in meters.-cylindersepThe separation of cylinders. This is the distance between the centres of adjacent cylinders. This means that the separation must be AT LEAST DOUBLE the cylinder radius in order to insure cylinders that do not overlap.
The duration of the simulation dynamics (in seconds) will be calculated from the schemefile. The simulation will run for long enough to accommodate the longest pulse sequence in the scheme file, defined as the time at which the final gradient pulse ends. By default, data synthesised will be noiseless, but Rician noise can be added by using the -snr switch. Different SNRs can be used to simulate the effect of different TEs in the data.
Generating results using data from a simulation
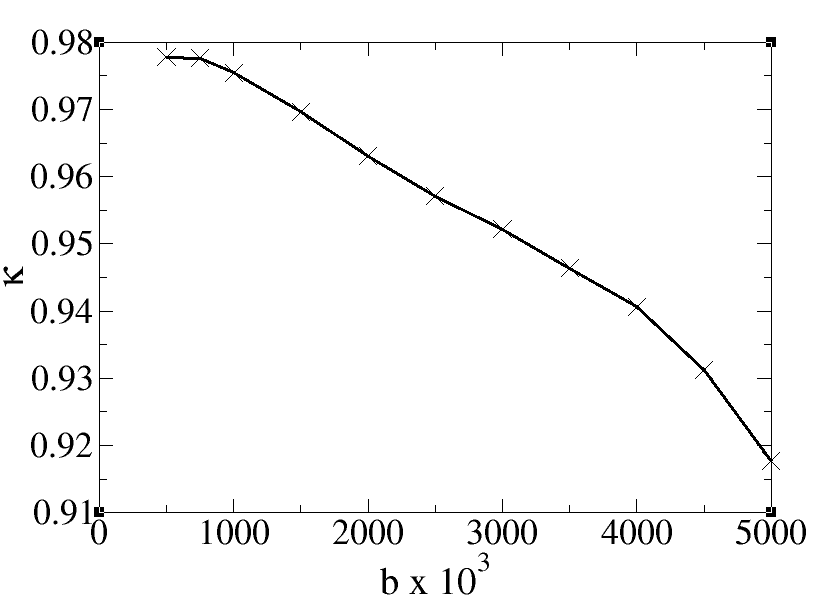
In the same way that we have examined the dependence of direction concentration on b-value using data from test functions, we can also see how these results differ if we use a simulation data instead of the test function. A command pipeline for getting direction concentration using simualtion data is:
datasynth -schemefile version1.scheme -voxels 1000 -walkers 10000 -tmax 100000 -p 0.0 -initial uniform -steptype fixedlength -snr 16.0 -substrate cylinder -packing HEX -cylinderrad 1E-6 -cylindersep 2.1E-6 | dtfit - test/bmx7.scheme | invstats > inversionStats.dat
This pipeline is the same as that used to generate results using a test function, except that this time the datasynth command is configured to produce simulation data. Setting any simulation parameter from the command line implicitly instructs datasynth to use a simulation to synthesise data.
The plot of direction concentration vs b value using simulation data is shown below:
Synthesising data with more than one principal diffusion direction
Test data with more than one principal diffusion direction per voxel can also be synthesised using the datasynth command. Test function 3 is a superposition of two diffusion tensors with diagonals (17,2,2) x 10-10m2s-1 and (2,17,2) x 10-10m2s-1 and so has principal directions parallel to the x and y axes. The command
datasynth -testfunc 3 -snr 16 -fixedmodq 3 49 200000 0.04 -voxels 25 > twoTensorData.Bfloat
specifies 25 voxels synthesised from two tensors with an SNR of 16, 3 zero measurements and 49 gradient direction acquisitions at a fixed wavenumber 200000m-1. Diffusion time is 0.04 seconds. This is equivalent to
datasynth -gaussmix 2 17E-10 0 0 2E-10 0 2E-10 0.5 2E-10 0 0 17E-10 0 2E-10 0.5 -snr 16 -fixedmodq 3 49 200000 0.04 -voxels 25 > twoTensorData.Bfloat
Here we have specified the tensors using the more flexible -gaussmix option. This option allows us to specify the number of diffusion tensors (2) and the upper triangular elements of the tensors directly (the following six arguments are the elements of the tensor D1, D1xx, D1xy, D1xz, D1yy, D1yz, D1zz and then the same for the second tensor) the final argument of the -gaussmix option is the mixing coefficient, 0.5.
The angle between the principal directions can either be controlled by the tensor elements or, more simply, by the -dtrotangle option, which applies a rotation to the second tensor in the test function.
Diffusion geometries with more than one principal direction are currently being added to Camino. These will be available soon.
References
[1] Alexander & Barker, NeuroImage 27 (2005) 357-367